How widely are companies using AI in 2026? The answer depends on whether a survey counts an enterprise adopting at least one technology, a worker using a tool, or employees of an adopting company. This page compiles 61 individually scoped statistics from official Eurostat, UK ONS, UK government, U.S. Census and Federal Reserve publications, with original links, four source-specific tables and six accessible visual comparisons.
Reporting convention: “2026” is the update year of this compilation. Some enterprise observations are from 2025, and some U.S. observations reflect May 2026. The source period and unit of analysis accompany each figure. This is a curated secondary reference based on original public statistics; TheSkillGrid did not conduct the government surveys.
Six figures to orient the comparison
EU 2025 enterprises with ≥10 persons employed
UK firms with ≥10 staff in June 2026
U.S. BTOS businesses in May 2026
Large EU enterprises in 2025
UK businesses handling digitised data (2025–26)
Sourced measures in this compilation
1. European enterprises: acceleration, but adoption is uneven
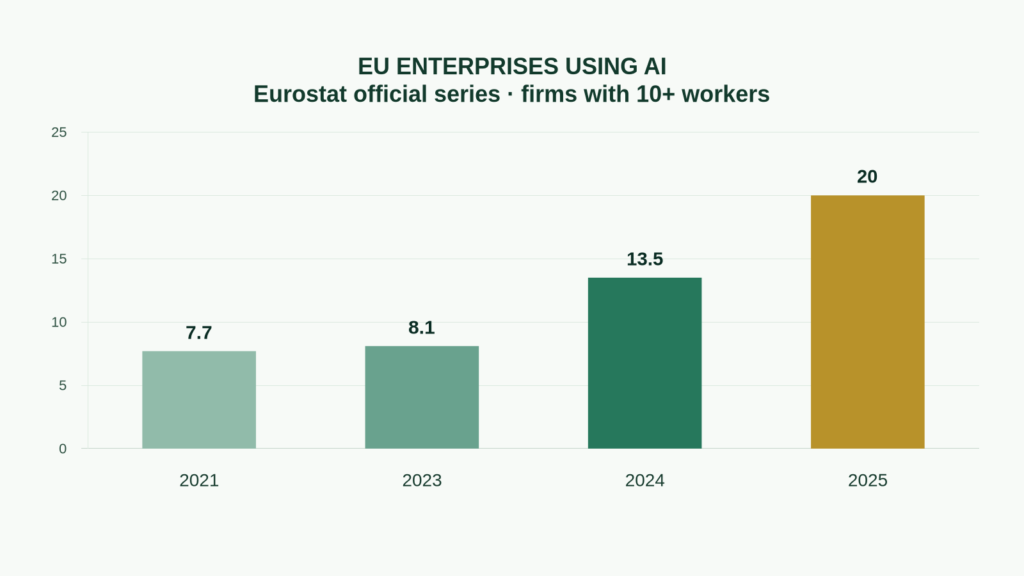
The EU’s official business measure rose from 13.5% in 2024 to 20.0% in 2025, a 6.5-percentage-point change. The survey covers enterprises employing at least ten people in its included industry categories, not sole traders or the entire universe of microbusinesses. A high adoption share does not tell us how deeply AI is integrated or whether any particular business has earned a financial return. Eurostat primary release.
Firm size is an important dividing line: Eurostat’s 2025 series reports 17% for small enterprises, 30.36% for medium enterprises and 55.03% for large enterprises. Country examples range from Denmark’s 42.0% to Romania’s 5.2%. These results can inform comparisons, but they should not be presented as proof that one country has more productive businesses than another.
7.7%
8.1%
13.5%
20%
Source: Eurostat, 20% of EU enterprises use AI (Dec 2025). Covered EU enterprises with at least ten persons employed; an annual survey, not every business.
17%
30.36%
55.03%
Source: Eurostat, Use of AI in Enterprises 2025. Eurostat size categories; percentages of firms in each size class. Small means the covered class, not micro-enterprises.
42%
37.8%
35%
8.5%
8.4%
5.2%
Source: Eurostat, 20% of EU enterprises use AI (Dec 2025). Selected high/low examples, not a complete ranking or representative sample.
2. UK business use: adoption versus intensity
The UK Office for National Statistics reports that use of at least one AI technology among businesses with ten or more employees grew from approximately 12% in late 2023 to approximately 35% by June 2026. Yet the average number of reported AI technology types per AI-adopting business moved only modestly, from roughly 1.4 to 1.6. That distinction is vital: a growing share of firms using one technology does not automatically imply a broad business transformation.
Sector differences are sharp in the ONS series: 58% for information and communication and 13% for construction. Large-language-model generation was used by approximately 18% of surveyed businesses with at least ten employees, with 16% reporting visual content generation. Because the same firm can use multiple technologies, these shares cannot be added together to estimate total users. ONS, July 2026 report.
58%
13%
Source: UK Office for National Statistics, Artificial intelligence in UK businesses (July 2026). UK BICS survey; sector-specific denominators; not a causation or productivity comparison.
18%
16%
12%
6%
2%
Source: UK Office for National Statistics, Artificial intelligence in UK businesses (July 2026). UK businesses with ≥10 employees; a firm can report more than one type.
3. Governance, data readiness and responsible deployment
A separate UK government study found that 41% of businesses handling digitised data reported at least one AI use. That is not a conflicting updated estimate of the ONS figure above: this survey has a different sample, field period, denominator and question design. Within the government study, 82% of large businesses handling digitised data reported AI use, versus 40% of sole traders in that population. The study also reported that 17% of AI-using businesses had no AI policy in place. UK Business Data Survey 2026.
The practical lesson for leadership and training design is not that every company needs the same product. Adoption processes require explicit choices about permitted workflows, sensitive data, human review, procurement, evaluation and change management. Training should help managers identify where AI can be useful, how outputs are checked, and who remains responsible for consequential decisions.
4. United States: business use differs from worker use
The U.S. Census Bureau’s Business Trends and Outlook Survey recorded an overall AI-use share of around 19.8% in the May 2026 wave, with 39.7% in information and 33.9% in finance and insurance. The Census questions changed in November 2025 to include use in any business function; earlier narrower results cannot be placed in the same trend line without clear qualification. Census Bureau, May 2026.
The Federal Reserve’s April 2026 synthesis combines different respondent types: approximately 18% of businesses used AI at year-end 2025 in Census data, whereas approximately 41% of individual respondents reported work-related generative AI use in November 2025. A separate survey of executives estimated that 78% of U.S. workers were employed at firms with some AI adoption and 54% worked at firms using large language models. Those latter rates do not imply that 78% or 54% of workers personally use AI. Federal Reserve evidence synthesis.
39.7%
33.9%
19.8%
Source: U.S. Census Bureau, Large firms biggest AI users (May 2026). U.S. BTOS, May 2026; information and finance samples compared against the nationwide survey rate.
Source-by-source reference tables: all 61 measures
The tables deliberately remain divided by collection method. Values are quoted or rounded as shown in the corresponding primary research; no weighted international average has been calculated.
5. EU country, firm-size and technology indicators
EU business adoption values are cross-referenced against the detailed Eurostat enterprise statistics and December 2025 official release. Enterprise-size data are documented in the detailed Eurostat statistics rather than the shorter news release.
| Indicator | Value | Reference period |
|---|---|---|
| Enterprise AI use | 7.7% | EU 2021 |
| Enterprise AI use | 8.1% | EU 2023 |
| Enterprise AI use | 13.5% | EU 2024 |
| Enterprise AI use | 20% | EU 2025 |
| Increase in enterprise AI-use share from 2024 to 2025 | 6.5 pp | 2024→2025 |
| Enterprise AI use: Small firms | 17% | 2025 |
| Enterprise AI use: Medium firms | 30.36% | 2025 |
| Enterprise AI use: Large firms | 55.03% | 2025 |
| Enterprise AI use: Denmark | 42% | 2025 |
| Enterprise AI use: Finland | 37.8% | 2025 |
| Enterprise AI use: Sweden | 35% | 2025 |
| Enterprise AI use: Romania | 5.2% | 2025 |
| Enterprise AI use: Poland | 8.4% | 2025 |
| Enterprise AI use: Bulgaria | 8.5% | 2025 |
| Year-on-year increase: Denmark | 14.5 pp | 2024→2025 |
| Year-on-year increase: Finland | 13.5 pp | 2024→2025 |
| Year-on-year increase: Lithuania | 12.5 pp | 2024→2025 |
| Enterprise use of AI for Analysing written language | 11.8% | 2025 |
| Enterprise use of AI for Generating pictures/video/sound | 9.5% | 2025 |
| Enterprise use of AI for Generating written or spoken language | 8.8% | 2025 |
| Enterprise use of AI for Speech recognition | 7.2% | 2025 |
| Increase in AI use for analysis of written language | 4.9 pp | 2024→2025 |
| Increase in AI use for written/spoken language generation | 3.4 pp | 2024→2025 |
Official source: Eurostat, 20% of EU enterprises use AI (Dec 2025). Each row belongs to this source’s specified population and definition; do not combine rows with other sources into a global figure.
6. UK business survey: adoption and intensity
National statistical survey self-report; the selection includes different employee-size denominators where stated.
| ONS BICS indicator | Value | Reference period |
|---|---|---|
| UK business AI use at start of BICS series | 12 % approximately | Late 2023 |
| UK business AI use by June 2026 | 35 % approximately | June 2026 |
| UK business AI use: micro firms | 28% | June 2026 |
| UK business AI use: largest firms | 49% | June 2026 |
| AI technologies used per adopting business: start | 1.4 technologies approximately | Late 2023 |
| AI technologies used per adopting business: June 2026 | 1.6 technologies approximately | June 2026 |
| UK firms using AI: Information and communication | 58% | June 2026 |
| UK firms using AI: Construction | 13% | June 2026 |
| UK firms using LLM / text generation | 18% | June 2026 |
| UK firms using Visual-content generation | 16% | June 2026 |
| UK firms using ML data processing | 12% | June 2026 |
| UK firms using ML image processing | 6% | June 2026 |
| UK firms using Robotics | 2% | June 2026 |
| UK firms using Other AI | 2% | June 2026 |
| AI users reporting extensive AI use | 10% | June 2026 |
| AI users reporting extensive AI use: micro firms | 17% | June 2026 |
| AI users reporting extensive AI use: largest firms | 9% | June 2026 |
| Businesses reporting that more than half of staff use AI daily | 15% | June 2026 |
| Employees using AI for work or education | 55% | 2026 |
Official source: UK Office for National Statistics, Artificial intelligence in UK businesses (July 2026). Each row belongs to this source’s specified population and definition; do not combine rows with other sources into a global figure.
7. UK government business-data and AI governance survey
The denominator here is predominantly businesses handling digitised data, not all businesses.
| UKBDS indicator | Value | Reference period |
|---|---|---|
| AI use among businesses handling digitised data | 41% | 2025–26 |
| Large business AI use | 82% | 2025–26 |
| Medium business AI use | 58% | 2025–26 |
| Small business AI use | 51% | 2025–26 |
| Micro business AI use | 41% | 2025–26 |
| Sole trader business AI use | 40% | 2025–26 |
| AI-using businesses reporting no AI policy | 17% | 2025–26 |
| Large firms with a formal written AI policy | 56% | 2025–26 |
| AI users aware of relevant regulatory guidance | 53% | 2025–26 |
| AI users finding the guidance clear | 19% | 2025–26 |
Official source: UK Department for Science, Innovation and Technology, UK Business Data Survey 2026. Each row belongs to this source’s specified population and definition; do not combine rows with other sources into a global figure.
8. U.S. Census and Federal Reserve AI adoption measures
The U.S. table groups BTOS statistics with a separate Fed synthesis. Per-row source and respondent type differ; see row notes and direct citations below.
| Survey / synthesis metric | Value | Reference period |
|---|---|---|
| U.S. businesses using AI in any business function, May wave | 19.8% | May 3 2026 |
| U.S. business AI use: 250 or more staff | 37% | May 2026 |
| U.S. business AI use: 100–249 staff | 32% | May 2026 |
| U.S. business AI use: Information industry | 39.7% | May 2026 |
| U.S. business AI use: Finance and insurance industry | 33.9% | May 2026 |
| U.S. business AI adoption by year-end 2025 | 18 % approximately | End 2025 |
| U.S. workers reporting work-related generative AI use | 41 % approximately | Nov 2025 |
| Labor force employed at firms that have adopted AI | 78 % approximately | Nov 2025 |
| Labor force employed at firms that use LLMs | 54 % approximately | Nov 2025 |
Official source: U.S. Census Bureau, Large firms biggest AI users (May 2026). Each row has its own source and population: BTOS from the Census Bureau, and a separate Federal Reserve synthesis of BTOS, worker surveys and business-executive data. These must not be treated as one survey.
Every fact with its population and limitation
- Enterprise AI use: 7.7%. EU 2021. Population: EU enterprises with ≥10 persons employed. Source: Eurostat, 20% of EU enterprises use AI (Dec 2025).
- Enterprise AI use: 8.1%. EU 2023. Population: EU enterprises with ≥10 persons employed. Source: Eurostat, 20% of EU enterprises use AI (Dec 2025).
- Enterprise AI use: 13.5%. EU 2024. Population: EU enterprises with ≥10 persons employed. Source: Eurostat, 20% of EU enterprises use AI (Dec 2025).
- Enterprise AI use: 20%. EU 2025. Population: EU enterprises with ≥10 persons employed. Source: Eurostat, 20% of EU enterprises use AI (Dec 2025).
- Increase in enterprise AI-use share from 2024 to 2025: 6.5 pp. 2024→2025. Population: EU enterprises ≥10; rounded headline. Source: Eurostat, 20% of EU enterprises use AI (Dec 2025).
- Enterprise AI use: Small firms: 17%. 2025. Population: EU; Eurostat-defined enterprise size. Source: Eurostat, Use of AI in Enterprises 2025.
- Enterprise AI use: Medium firms: 30.36%. 2025. Population: EU; Eurostat-defined enterprise size. Source: Eurostat, Use of AI in Enterprises 2025.
- Enterprise AI use: Large firms: 55.03%. 2025. Population: EU; Eurostat-defined enterprise size. Source: Eurostat, Use of AI in Enterprises 2025.
- Enterprise AI use: Denmark: 42%. 2025. Population: Covered enterprises ≥10 in Denmark. Source: Eurostat, 20% of EU enterprises use AI (Dec 2025).
- Enterprise AI use: Finland: 37.8%. 2025. Population: Covered enterprises ≥10 in Finland. Source: Eurostat, 20% of EU enterprises use AI (Dec 2025).
- Enterprise AI use: Sweden: 35%. 2025. Population: Covered enterprises ≥10 in Sweden. Source: Eurostat, 20% of EU enterprises use AI (Dec 2025).
- Enterprise AI use: Romania: 5.2%. 2025. Population: Covered enterprises ≥10 in Romania. Source: Eurostat, 20% of EU enterprises use AI (Dec 2025).
- Enterprise AI use: Poland: 8.4%. 2025. Population: Covered enterprises ≥10 in Poland. Source: Eurostat, 20% of EU enterprises use AI (Dec 2025).
- Enterprise AI use: Bulgaria: 8.5%. 2025. Population: Covered enterprises ≥10 in Bulgaria. Source: Eurostat, 20% of EU enterprises use AI (Dec 2025).
- Year-on-year increase: Denmark: 14.5 pp. 2024→2025. Population: Covered enterprises ≥10; national AI-adoption share. Source: Eurostat, 20% of EU enterprises use AI (Dec 2025).
- Year-on-year increase: Finland: 13.5 pp. 2024→2025. Population: Covered enterprises ≥10; national AI-adoption share. Source: Eurostat, 20% of EU enterprises use AI (Dec 2025).
- Year-on-year increase: Lithuania: 12.5 pp. 2024→2025. Population: Covered enterprises ≥10; national AI-adoption share. Source: Eurostat, 20% of EU enterprises use AI (Dec 2025).
- Enterprise use of AI for Analysing written language: 11.8%. 2025. Population: EU covered enterprises ≥10; technology types overlap. Source: Eurostat, 20% of EU enterprises use AI (Dec 2025).
- Enterprise use of AI for Generating pictures/video/sound: 9.5%. 2025. Population: EU covered enterprises ≥10; technology types overlap. Source: Eurostat, 20% of EU enterprises use AI (Dec 2025).
- Enterprise use of AI for Generating written or spoken language: 8.8%. 2025. Population: EU covered enterprises ≥10; technology types overlap. Source: Eurostat, 20% of EU enterprises use AI (Dec 2025).
- Enterprise use of AI for Speech recognition: 7.2%. 2025. Population: EU covered enterprises ≥10; technology types overlap. Source: Eurostat, 20% of EU enterprises use AI (Dec 2025).
- Increase in AI use for analysis of written language: 4.9 pp. 2024→2025. Population: EU enterprises ≥10; one AI application. Source: Eurostat, 20% of EU enterprises use AI (Dec 2025).
- Increase in AI use for written/spoken language generation: 3.4 pp. 2024→2025. Population: EU enterprises ≥10; one AI application. Source: Eurostat, 20% of EU enterprises use AI (Dec 2025).
- UK business AI use at start of BICS series: 12 % approximately. Late 2023. Population: UK firms ≥10. Rounded, not an exact survey percentage. Source: UK Office for National Statistics, Artificial intelligence in UK businesses (July 2026).
- UK business AI use by June 2026: 35 % approximately. June 2026. Population: UK firms ≥10. Rounded, not a comparable measure to UKBDS. Source: UK Office for National Statistics, Artificial intelligence in UK businesses (July 2026).
- UK business AI use: micro firms: 28%. June 2026. Population: UK businesses 0–9 employees. ONS BICS firm-size breakdown. Source: UK Office for National Statistics, Artificial intelligence in UK businesses (July 2026).
- UK business AI use: largest firms: 49%. June 2026. Population: UK firms ≥250 employees. ONS BICS firm-size breakdown. Source: UK Office for National Statistics, Artificial intelligence in UK businesses (July 2026).
- AI technologies used per adopting business: start: 1.4 technologies approximately. Late 2023. Population: UK AI-adopting business respondents ≥10. Source: UK Office for National Statistics, Artificial intelligence in UK businesses (July 2026).
- AI technologies used per adopting business: June 2026: 1.6 technologies approximately. June 2026. Population: UK AI-adopting business respondents ≥10. Source: UK Office for National Statistics, Artificial intelligence in UK businesses (July 2026).
- UK firms using AI: Information and communication: 58%. June 2026. Population: UK businesses in named industry; self-reported. Source: UK Office for National Statistics, Artificial intelligence in UK businesses (July 2026).
- UK firms using AI: Construction: 13%. June 2026. Population: UK businesses in named industry; self-reported. Source: UK Office for National Statistics, Artificial intelligence in UK businesses (July 2026).
- UK firms using LLM / text generation: 18%. June 2026. Population: UK firms ≥10; type categories overlap. Source: UK Office for National Statistics, Artificial intelligence in UK businesses (July 2026).
- UK firms using Visual-content generation: 16%. June 2026. Population: UK firms ≥10; type categories overlap. Source: UK Office for National Statistics, Artificial intelligence in UK businesses (July 2026).
- UK firms using ML data processing: 12%. June 2026. Population: UK firms ≥10; type categories overlap. Source: UK Office for National Statistics, Artificial intelligence in UK businesses (July 2026).
- UK firms using ML image processing: 6%. June 2026. Population: UK firms ≥10; type categories overlap. Source: UK Office for National Statistics, Artificial intelligence in UK businesses (July 2026).
- UK firms using Robotics: 2%. June 2026. Population: UK firms ≥10; type categories overlap. Source: UK Office for National Statistics, Artificial intelligence in UK businesses (July 2026).
- UK firms using Other AI: 2%. June 2026. Population: UK firms ≥10; type categories overlap. Source: UK Office for National Statistics, Artificial intelligence in UK businesses (July 2026).
- AI users reporting extensive AI use: 10%. June 2026. Population: UK AI-adopting firms ≥10. Subgroup only, not all businesses. Source: UK Office for National Statistics, Artificial intelligence in UK businesses (July 2026).
- AI users reporting extensive AI use: micro firms: 17%. June 2026. Population: UK AI-adopting firms 0–9. Subgroup only. Source: UK Office for National Statistics, Artificial intelligence in UK businesses (July 2026).
- AI users reporting extensive AI use: largest firms: 9%. June 2026. Population: UK AI-adopting firms ≥250. Subgroup only. Source: UK Office for National Statistics, Artificial intelligence in UK businesses (July 2026).
- Businesses reporting that more than half of staff use AI daily: 15%. June 2026. Population: UK businesses ≥10. Early self-report; new question. Source: UK Office for National Statistics, Artificial intelligence in UK businesses (July 2026).
- Employees using AI for work or education: 55%. 2026. Population: UK individual-respondent measure. Not the same population or definition as 35% business-use share. Source: UK Office for National Statistics, Artificial intelligence in UK businesses (July 2026).
- AI use among businesses handling digitised data: 41%. 2025–26. Population: UK businesses handling digitised data. Not the share of all UK businesses. Source: UK Department for Science, Innovation and Technology, UK Business Data Survey 2026.
- Large business AI use: 82%. 2025–26. Population: UK large businesses handling digitised data. Source: UK Department for Science, Innovation and Technology, UK Business Data Survey 2026.
- Medium business AI use: 58%. 2025–26. Population: UK medium businesses handling digitised data. Source: UK Department for Science, Innovation and Technology, UK Business Data Survey 2026.
- Small business AI use: 51%. 2025–26. Population: UK small businesses handling digitised data. Source: UK Department for Science, Innovation and Technology, UK Business Data Survey 2026.
- Micro business AI use: 41%. 2025–26. Population: UK micro businesses handling digitised data. Source: UK Department for Science, Innovation and Technology, UK Business Data Survey 2026.
- Sole trader business AI use: 40%. 2025–26. Population: UK sole trader businesses handling digitised data. Source: UK Department for Science, Innovation and Technology, UK Business Data Survey 2026.
- AI-using businesses reporting no AI policy: 17%. 2025–26. Population: UK businesses using AI. Subgroup only. Source: UK Department for Science, Innovation and Technology, UK Business Data Survey 2026.
- Large firms with a formal written AI policy: 56%. 2025–26. Population: UK large AI-using businesses. Within policy section; ensure wording stays conditional. Source: UK Department for Science, Innovation and Technology, UK Business Data Survey 2026.
- AI users aware of relevant regulatory guidance: 53%. 2025–26. Population: UK AI-using businesses. Not general UK business awareness. Source: UK Department for Science, Innovation and Technology, UK Business Data Survey 2026.
- AI users finding the guidance clear: 19%. 2025–26. Population: UK AI-using businesses. Survey-reported. Source: UK Department for Science, Innovation and Technology, UK Business Data Survey 2026.
- U.S. businesses using AI in any business function, May wave: 19.8%. May 3 2026. Population: U.S. businesses responding to BTOS. Question updated November 2025. Source: U.S. Census Bureau, Large firms biggest AI users (May 2026).
- U.S. business AI use: 250 or more staff: 37%. May 2026. Population: U.S. BTOS businesses in named cohort. Sector and firm size are not directly comparable to EU. Source: U.S. Census Bureau, Large firms biggest AI users (May 2026).
- U.S. business AI use: 100–249 staff: 32%. May 2026. Population: U.S. BTOS businesses in named cohort. Sector and firm size are not directly comparable to EU. Source: U.S. Census Bureau, Large firms biggest AI users (May 2026).
- U.S. business AI use: Information industry: 39.7%. May 2026. Population: U.S. BTOS businesses in named cohort. Sector and firm size are not directly comparable to EU. Source: U.S. Census Bureau, Large firms biggest AI users (May 2026).
- U.S. business AI use: Finance and insurance industry: 33.9%. May 2026. Population: U.S. BTOS businesses in named cohort. Sector and firm size are not directly comparable to EU. Source: U.S. Census Bureau, Large firms biggest AI users (May 2026).
- U.S. business AI adoption by year-end 2025: 18 % approximately. End 2025. Population: U.S. BTOS businesses. Fed synthesis, before 2026 May Census wave. Source: U.S. Federal Reserve, Monitoring AI Adoption in the US Economy (Apr 2026).
- U.S. workers reporting work-related generative AI use: 41 % approximately. Nov 2025. Population: U.S. individual respondents to RPS. People, not businesses. Source: U.S. Federal Reserve, Monitoring AI Adoption in the US Economy (Apr 2026).
- Labor force employed at firms that have adopted AI: 78 % approximately. Nov 2025. Population: U.S. employment-weighted SBU executive survey. Population is workers at adopting firms, not the share personally using AI. Source: U.S. Federal Reserve, Monitoring AI Adoption in the US Economy (Apr 2026).
- Labor force employed at firms that use LLMs: 54 % approximately. Nov 2025. Population: U.S. employment-weighted SBU executive survey. Firm-level use, not individual employee use. Source: U.S. Federal Reserve, Monitoring AI Adoption in the US Economy (Apr 2026).
9. Methodology and what these numbers cannot establish
This page uses only official-source figures present in the cited releases, not unverified AI-industry infographics. Eurostat covers a defined universe of EU enterprises with at least ten persons employed. The UK ONS Business Insights and Conditions Survey captures self-reports at different firm-size cuts. The UK Business Data Survey often conditions its headline on businesses that handle digitised data. The Census Bureau’s U.S. BTOS uses a biweekly business sample, and its question on AI was broadened in November 2025. The Federal Reserve note discusses three survey designs rather than presenting one comparable set of counts.
Three comparisons are particularly misleading if taken out of context. First, the 2025 EU figure and June 2026 UK figure refer to different populations and timing, so they do not support a simple assertion that one market “leads” the other. Second, share of firms using AI does not establish how many staff use AI at work; a firm may report minimal use while workers use tools individually. Third, AI adoption rates do not directly measure displacement, wages, return on investment or business productivity.
We do not combine numbers from different studies into an artificial “global adoption rate,” convert self-reported adoption to financial benefits, or treat technology selection as an endorsement. Journalists should identify the publisher, period, population, precise question and rounded status alongside any quoted percentage.
10. What organisations can do with the evidence
Business leaders can use these official data as context for a skills and governance needs assessment—not as a substitute for their own baseline. Start by identifying AI-supported tasks, assessing what employees understand, documenting permissible data handling, and reviewing accuracy and escalation controls. Only then choose the practical learning experiences needed for managers and affected teams.
For more tailored training, explore AI for Business Leaders, other professional training courses, and AI, digital governance and leadership academies. TheSkillGrid’s courses are an optional capability-building response to the evidence, not products endorsed by the official data sources.
FAQ: citing AI adoption statistics correctly
What share of companies use AI in 2026?
There is no single universal percentage. For example, the EU reported 20% of covered enterprises using AI in 2025, the UK ONS reported around 35% of firms with ten or more employees using AI in June 2026, and the U.S. Census measured about 19.8% in its May 2026 business wave. The definitions and population floors differ.
Does “78% of the labour force works at AI-adopting firms” mean 78% of workers use AI?
No. That Federal Reserve-cited estimate is employment-weighted firm-level adoption; it counts workers at firms using AI, whether or not those particular workers use an AI tool.
Why does the UK government survey report 41% while the ONS article reports 35%?
The 41% comes from a separate survey restricted to businesses handling digitised data and conducted in 2025–26. The ONS BICS rate refers to a different survey and sample in June 2026. They should not be combined into a growth percentage.
Can enterprise AI adoption be treated as proof of job losses or productivity increases?
No. These adoption figures describe reported technology use; they do not, by themselves, identify causal effects on employment or productivity.
Primary-source bibliography and reuse notes
- Eurostat, Use of AI in Enterprises 2025 — 2025 enterprise survey. EU covered enterprises with at least 10 persons employed.
- Eurostat, 20% of EU enterprises use AI (Dec 2025) — 2025. EU enterprises with at least 10 persons employed.
- UK Office for National Statistics, Artificial intelligence in UK businesses (July 2026) — BICS September 2023–June 2026. UK surveyed businesses; size floor varies by metric.
- UK Department for Science, Innovation and Technology, UK Business Data Survey 2026 — October 2025–January 2026 responses. UK surveyed businesses, often restricted to handlers of digitised data.
- U.S. Census Bureau, Large firms biggest AI users (May 2026) — BTOS Dec 2025–May 2026. U.S. businesses in biweekly Business Trends and Outlook Survey.
- U.S. Federal Reserve, Monitoring AI Adoption in the US Economy (Apr 2026) — 2025 results across three surveys. Mixed: U.S. firms, individual workers and employment-weighted executive sample.
Editorial date: This research compilation is prepared against sources available through 27 October 2026. When official agencies publish revised series, verify source values before updating or quoting this page.
Attribution guidance: Link directly to the relevant primary agency and quote the reporting year, respondent population and question. Charts shown here are independently recreated from officially reported numeric values and are not agency-provided artwork.
Develop this capability in your organization